Feature Contents:Feature Article
Feature article: Toward an exit strategy [2] – Effective flows of people and confirmation of vaccination history –
The following article provides a summary of the results of analysis conducted after the resolution of the fifth wave of infections, focusing on exit strategies for the pandemic with a view towards medium- to long-term containment of infection. In particular, the following presents the views at the time on measures other than vaccinations.
Introduction
At present, the fifth wave has been brought under control in Japan and the infection situation is relatively
stable. On the other hand, it is still necessary to consider measures that allow economic activity to
recover and prevent infections spreading again in the medium to long term.
In particular, it will be essential to take preventive measures against the spread of infections in
situations where the flows of people in the community are expected to increase, so consideration of those
measures, their scale and the timing of their implementation is required.1.
On this AI simulation project, multiple researchers have been using various methods and models to analyze
scenarios with similar assumptions in order to consider the situation from multiple perspectives. (* Link
about the COVID-19 AI simulation project) As a common result of these analyses, it is suggested that a
vaccine-only measure may require a vaccination rate of 85% of the whole population to prevent infections
from spreading again, and if children aged up to 12 years are not vaccinated, a vaccination rate in excess
of 90% for people aged 12 years and older may be required. On the other hand, these figures cannot be
achieved easily given that age limits have been established for vaccinations and the fact that some people
cannot be vaccinated for various reasons1. In addition, as vaccine infection prevention effects, etc.,
decrease over time2, booster vaccinations are required to maintain those effects even supposing that 85% of
the whole population is vaccinated. So apart from vaccination, what kinds of measures are possible? We
grasped the present correctly and considered the measures required.
※It should be noted that the following are the results of calculations and simulations by
researchers, and not the official opinion of the national government.
1 The effective flow of people that holds the key to the rapid decline of the fifth wave
- The suppression of flows of people through lockdowns and other restrictions on activity was attempted as a measure to control infections in various foreign countries. On the other hand, increases in flows of people are unavoidable in the resumption of economic activity.
- It is necessary to confirm the trend of “effective flows of people” and take the measures required, rather than suppressing flows of people, which has been used as an index in the past.
Why did the fifth wave of infections come under control so quickly even though flows of people did not
decrease that much? The concept of “effective flows of people” exists as a candidate answer to that
question, which sounds like a paradox.
With past spreads of infections (third, fourth and fifth waves), it was possible to confirm the phenomenon
of the effective reproduction number rising in association with increased flows of people. On the other
hand, a different trend could be seen in the latter half of the fifth wave (from September), when the
vaccination rate increased, and although flows of people tended to increase, the effective reproduction
number did not. It is thought that the main reason for this is that while the proportion of people with IgG
antibodies due to vaccines increased, on the other hand, the flow of people without antibodies taking
actions with a high risk of infection was suppressed effectively by things like media reports of pressure on
the medical system.
It is important to sort out what you are referring to when you say “flow of people” like here. For example,
the flow of people at a major station from morning to evening is a flow of people that occurs in association
with business activities such as commuting (here referred to as “commuter flow”), and this does not decrease
except on weekends and major consecutive holidays (Year-end and New Year holidays, Obon holidays, Golden
Week, etc.) unless measures like telework expand dramatically. However, when the actual data is looked at,
it can be understood that commuter flow decreased uniformly to a certain degree in 2021 compared to the
second half of 2020. At Shinagawa Station, for example, commuter flow in the latter half of 2020 was 50% of
the level prior to COVID-19, but was about 60% lower in 2021 and so about 20% lower than the latter half of
2020. In addition, a decrease of about 10% to 20% was observed during the transition from the prevention of
the spread of infections to the declaration of a state of emergency.
On the other hand, flows of people in downtown areas at nighttime (here referred to here as “nighttime
flow”) are highly likely to involve high-risk behavior because it is assumed to correlate with meals,
karaoke, and going in and out of facilities subject to the Act on Control and Improvement of Amusement
Business, etc. However, it needs to be kept in mind that the high-risk behaviors and locations are not the
same with the more infectious Delta strain and earlier variants.
After the declaration of the state of emergency in response to the fifth wave, nighttime flow decreased
gradually, by 20 to 30% from before the declaration and by about 70% compared to before COVID-19. Before the
fifth wave, there was a sharp and significant decrease in flows of people before and after a declaration of
a state of emergency came into effect, but there was no sudden decrease after the declaration in response to
the fifth wave and flows decreased gradually down to the Obon holidays in mid-August.
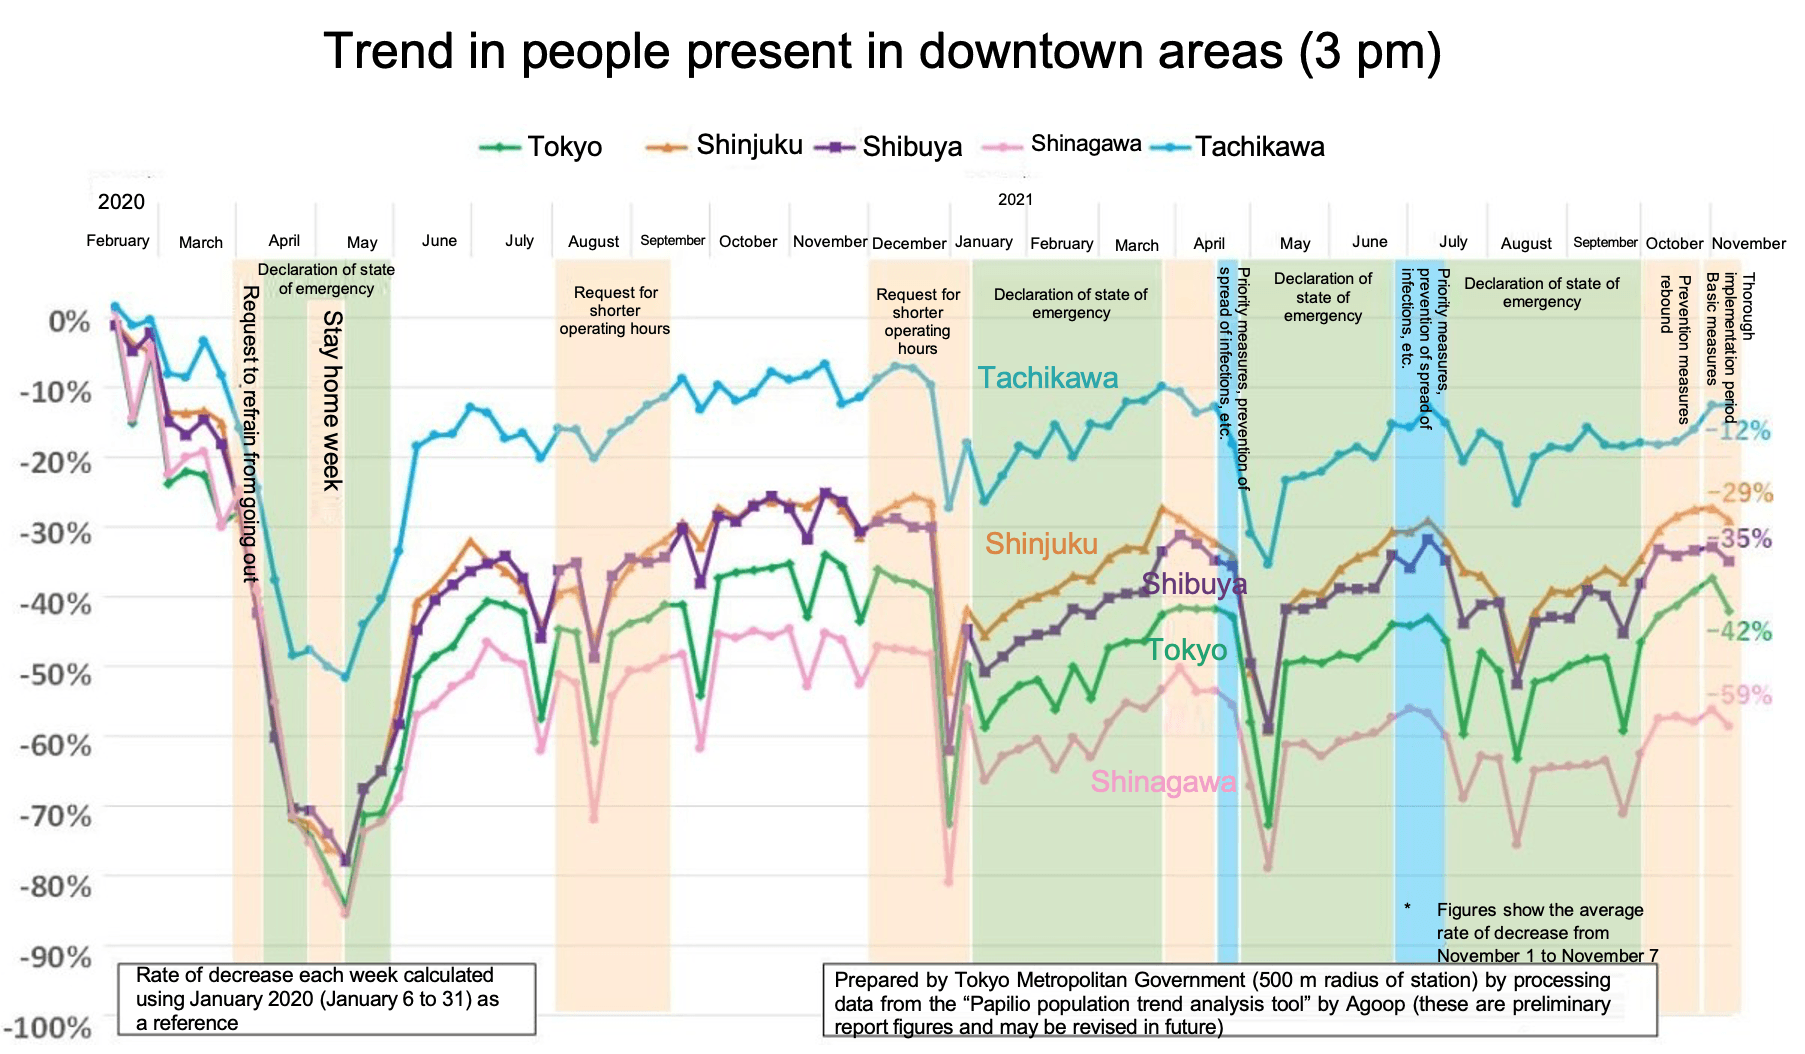
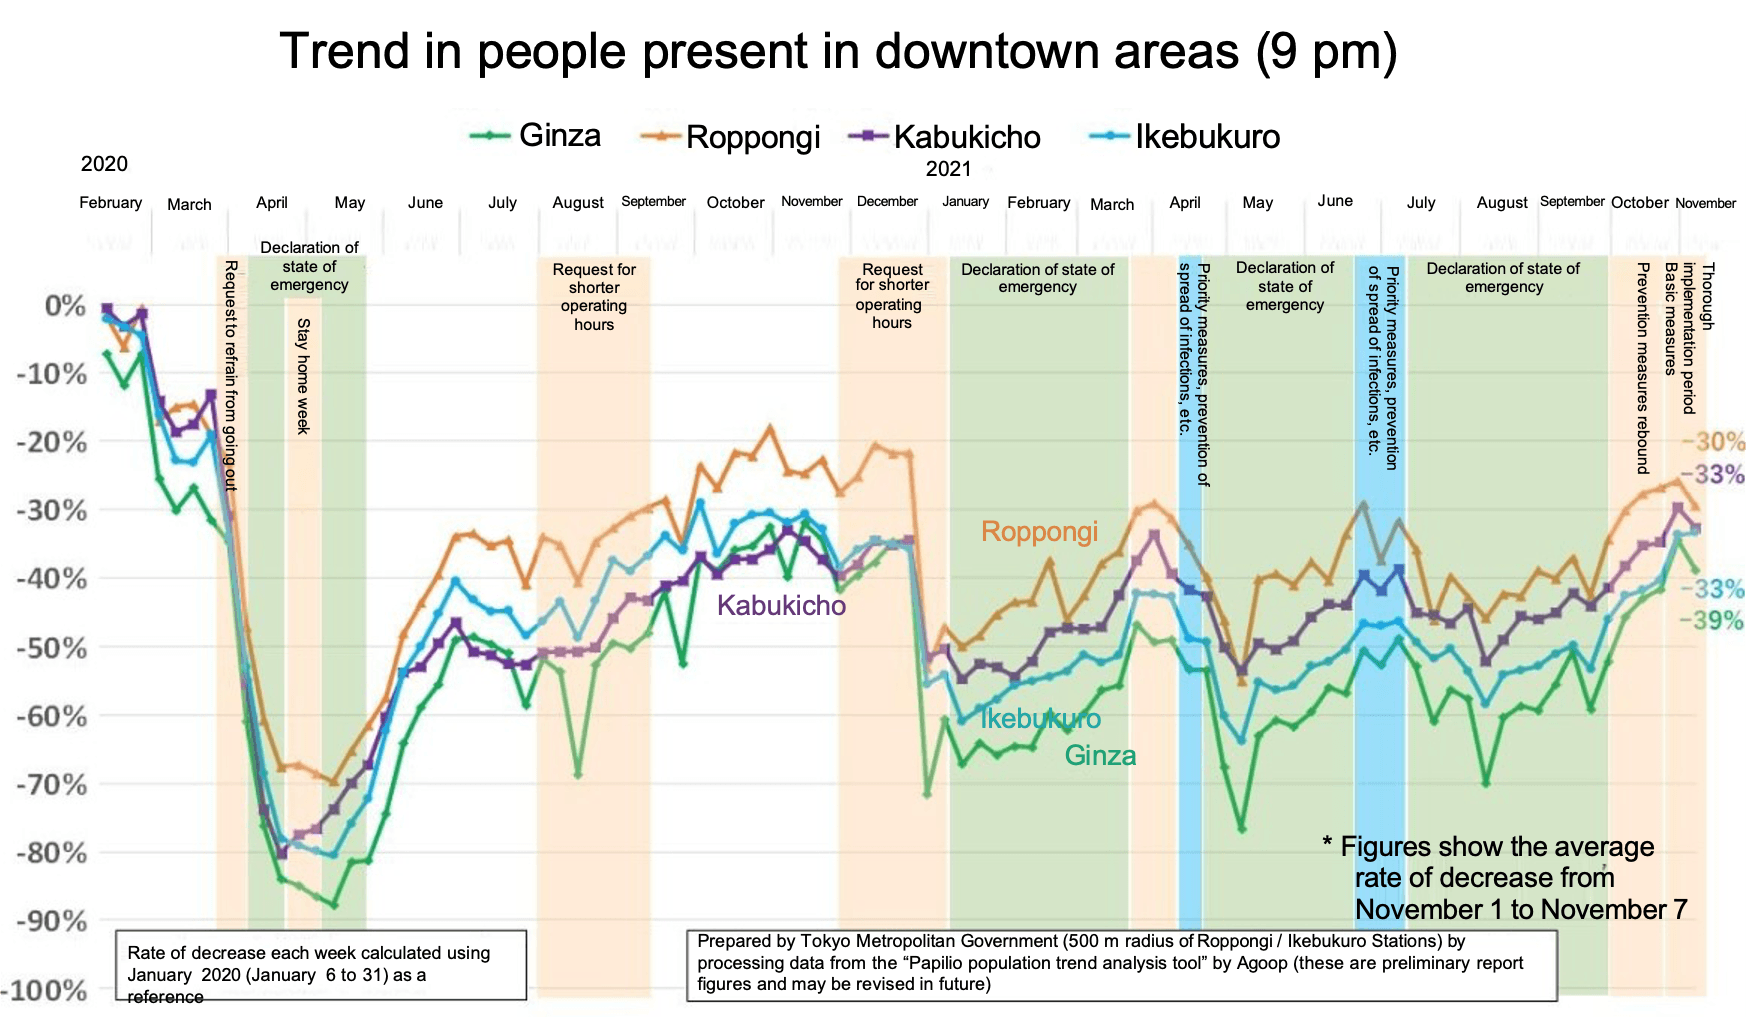
Figure 1: Flows of people around the main stations and downtown areas
From, Office of the Governor for Policy Planning, Tokyo Metropolitan Government, “State of crowding in
downtown Tokyo and changes in the number of people present”
(/action/survey/covid19-ai.jp/ja-jp/presentation/2021_rq3_countermeasures_simulation/articles/article140/)
The same changes as commuter flow were apparent in the decreases in the latter half of 2020 and 2021 and during the transition from preventing the spread of infections to the declaration of an emergency, with the size of the decrease tending to be slightly larger than commuter flow. This is more evident when looking at data on people present by time zone (Figure 2). For example, if you look at the change from 6pm to 8pm in contrast to the change in daytime population from 12 noon to 6pm, it can be seen that the number of people present was almost the same in the latter half of 2020, but in 2021, the decrease in people present from 6pm to 8pm was large. This is marked in particular during the period of the declaration of a state of emergency.
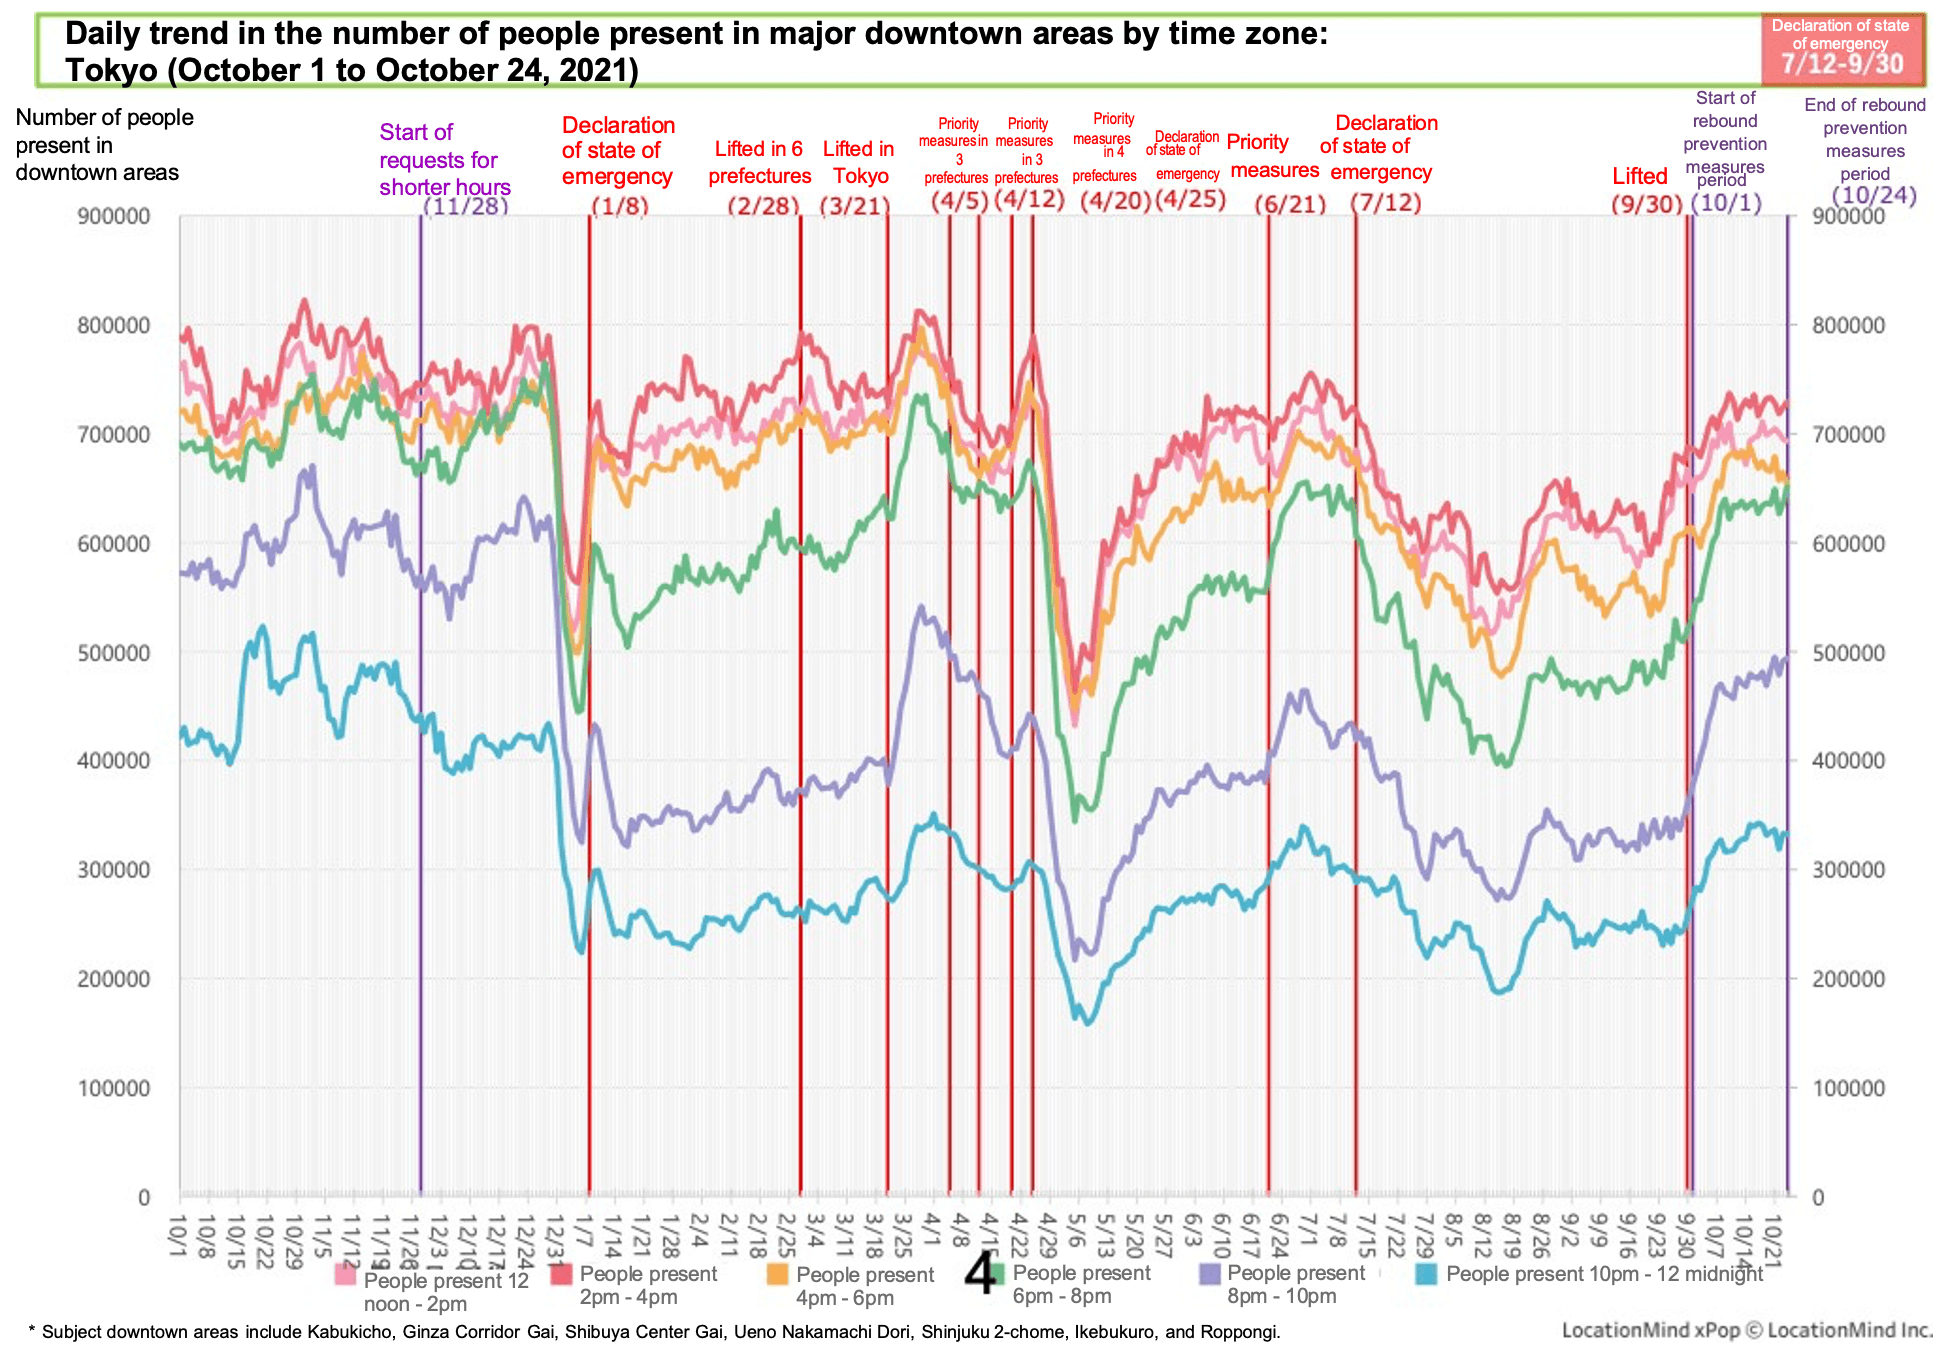
Figure 2: People present in major downtown areas in Tokyo by time zone
(From Ministry of Health, Labour and Welfare Advisory Board materials,
https://www.mhlw.go.jp/content/10900000/000847823.pdf
Analysis of the relationship between these changes in flows of people and the spread and decrease of
infections is shown in Figure 3. In this analysis, the correlation between changes in flows of people at
stations during the third, fourth and fifth waves and the effective reproduction number is visualized. From
this, a certain correlation can be seen during the infection spread phase of the third and fourth waves
between flows of people and the effective reproduction number. However, in the decreasing phase, there is an
inverse correlation between flows of people and the effective reproduction number. It is thought this may be
due to flows of people returning while continuing to see a decrease in infections. If analyzing the
relationship between flows of people and the spread of infections without distinguishing between the spread
phase and the control phase, this kind of correlation trend may not be found. In order to analyze the
relationship between “flows of people” and the state of infections, detailed analysis is essential,
including classification of whether it is during a period of spread or control, and whether downtown
population is during the day or at night. The fact is that infections do not occur randomly and the risk of
infection increases if people take high-risk actions. Therefore, it is important to ascertain not simply how
many people are moving, but how many people are moving in places and at times of high-risk behavior.
Moreover, we have found that in the Kinki region, flows of people and the spread of infections correlate
strongly in the north and south of Osaka and around the major stations, but in Tokyo, this correlation is
relatively weak. This raises the possibility that the places at risk of infection are more diverse and
dispersed in Tokyo than in other areas. In addition, a change has also been seen from the period when
frequently occurring cases of infections clusters were mainly during eating and drinking, and at hospitals
and facilities for the elderly, etc., to places where children and students in the age groups that have not
been vaccinated gather (childcare centers and schools). In other words, ascertaining the qualitative aspects
of flows of people is important.
As for increases in flows of people during periods when infections come under control, in the past, it was
thought that such flows of people would lead to the next spread of infection and that is actually what
happened. During the fifth wave too, a correlation between the flow of people at major stations and the
effective reproduction number was observed during the period of spreading infections following the expansion
of flows of people from the control phase of the fourth wave, but an increase in the effective reproduction
number not correlated with a change in the flow of people was observed during the period the Olympics were
held. This is thought to have been the result of specific changes in the quality of behavior during this
period.
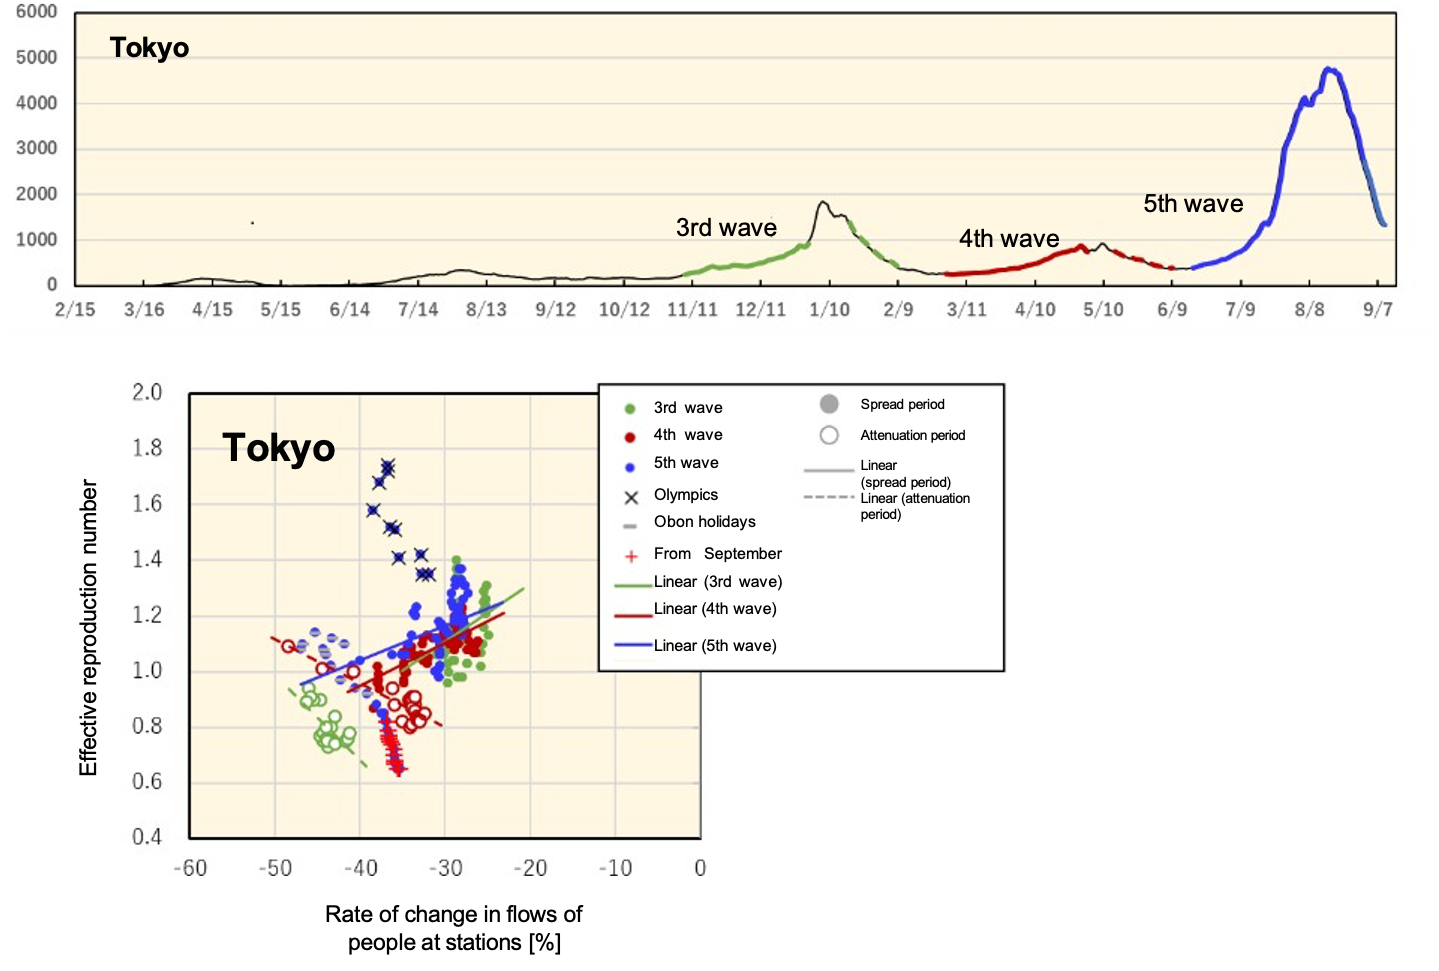
Figure 3: Relationship between flows of people in Tokyo and effective reproduction number (analysis by
Professor Hirata, Nagoya Institute of Technology)
Related research: RQ4: “Development of a prediction system for numbers of infections and cases of severe
illness in consideration of flows of people and season,
/action/survey/covid19-ai.jp/ja-jp/presentation/2021_rq3_countermeasures_simulation/articles/article144/
In addition, since July, vaccinations have started for working people aged up to 65 and the proportion of
people at high risk of infection for reasons such as being unvaccinated among people going out has decreased
rapidly. In order for infections to spread, the presence of people who can be infected is required and the
flows of such people are known as “effective flows of people.” Because the number of people with high IgG
levels after vaccination whose infection prevention effect is being maintained is increasing, and the
quality of flows of people has changed greatly, it is necessary to focus on the “effective flow of people”
(the flow of people made up of people with a risk of infection). In other words, the presence of people who
can be infected in places where the risk of infection is high is the effective flow of people.
In Japan, vaccination of working generations began in earnest from the beginning of July and was the fastest
in the world at a peak of 1.7 million vaccinations a day. When these effects are considered, it is thought
that the effective figure for high risk nighttime flow decreased almost the same as it did under the first
declaration of a state of emergency (Figure 4). In other words, the observation that “although flows of
people are not decreasing, infections are decreasing” in the phase of the fifth wave when infections were
decreasing is superficial, and it is thought that nighttime effective flow, which appears to be related
strongly to infections, was dramatically reduced.
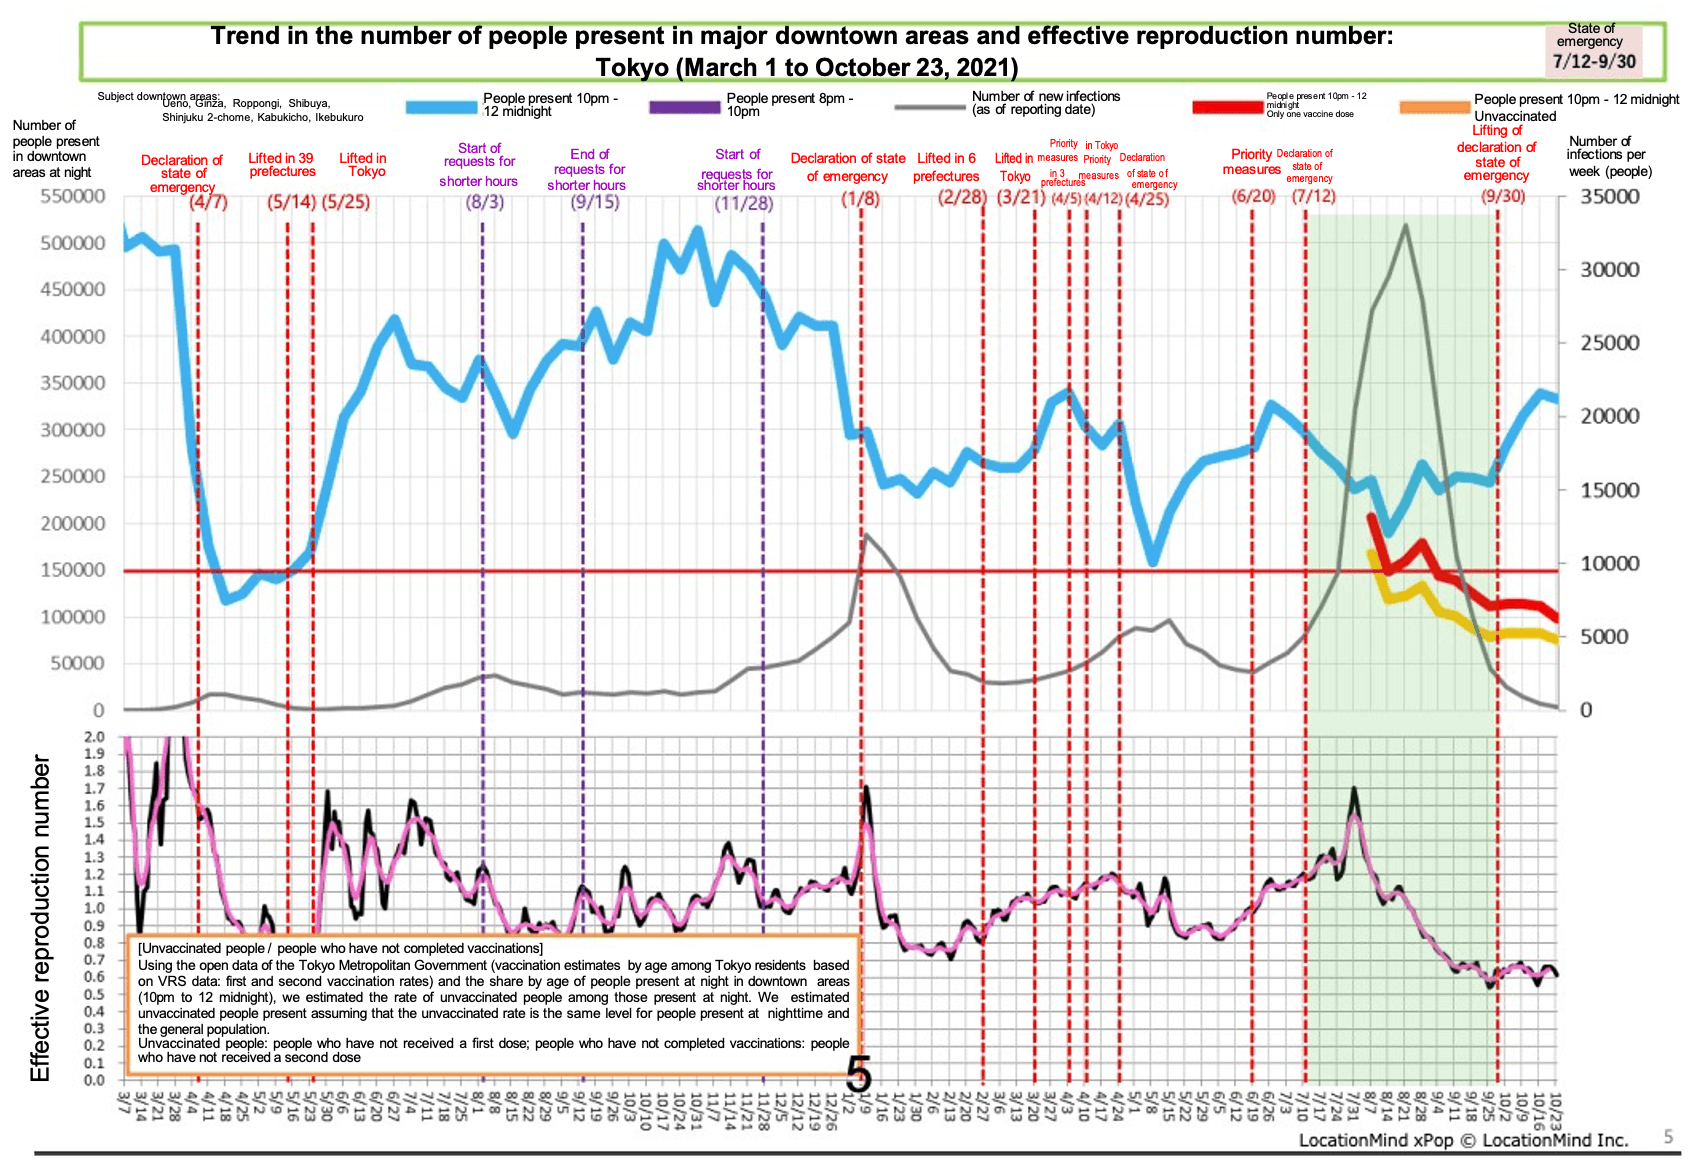
Figure 4: Changes in effective flows of people including impact of vaccinations From Ministry of Health,
Labour and Welfare Advisory Board materials
https://www.mhlw.go.jp/content/10900000/000847823.pdf
3. It is also thought to be fortunate that the timing of the decrease in flows of people during the Obon holiday coincided with the increase in the number of people who had completed the second dose of vaccinations. flows is maintained due to confirmation of vaccination history can be confirmed after introduction of the measure.
2 Effects due to introduction of confirmation of vaccination history
- If the final rate of vaccination is 75% or 80%, Japan may repeat large waves of changes over the next five years.
- If you look at the cases of the UK and Singapore where confirmation of vaccination history was introduced, it is possible to confirm the reduction of the effective reproduction number due to changes in the quality of flows of people.
The introduction of confirmation of vaccination history has advanced in various foreign countries as a means of controlling “effective flows of people.” In the UK and Singapore, which introduced confirmation of vaccination history earlier than other countries, the phenomenon of decreasing effective reproduction while the overall volume of human
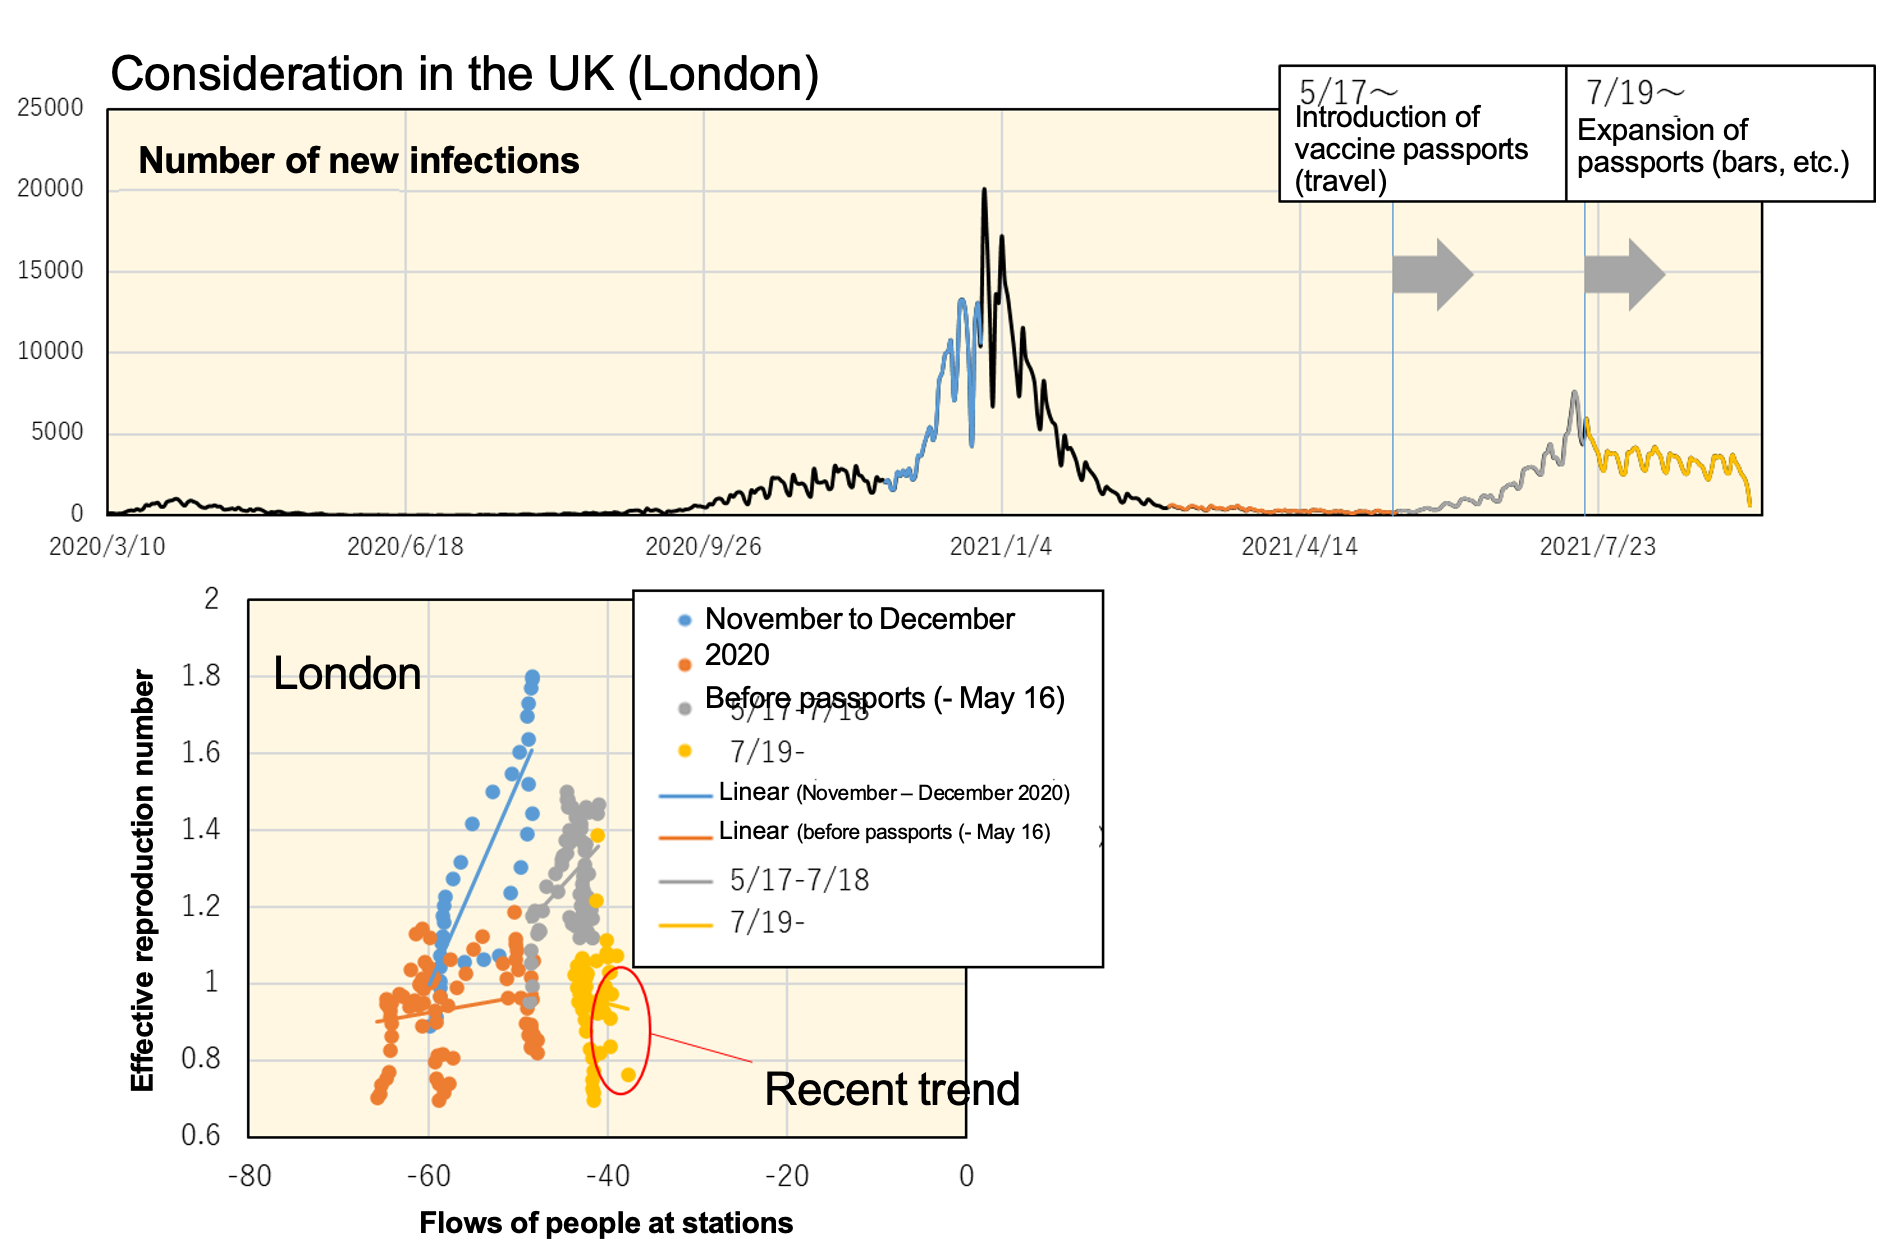
Figure 5: Effective reproduction number before and after the introduction of confirmation of vaccination
history in London (analysis by Professor Hirata, Nagoya Institute of Technology)
Related research: RQ4: “Estimation of the effect of priority vaccinations by age group,”
(/action/survey/covid19-ai.jp/ja-jp/presentation/2021_rq3_countermeasures_simulation/articles/article144/)
In the case of London (Figure 5), the effective reproduction number was kept below one while maintaining
flows of people due to the introduction of confirmation of vaccination history for travel and bars, etc.,
which were likely to be the origin of the spread of infections. This tendency was also observed in
Singapore, and the effectiveness of the measure is recognized.
It is thought that confirmation of vaccination history, which can encourage changes in the quality of flows
of people like this, is effective as a complementary measure that prevents the spread of infections while
allowing economic activity to recover in a situation where vaccinations are not possible for various
reasons, sufficient effects are not obtained after vaccination and the effects of the vaccine decrease over
time.
3 The possibility of infection control based on the introduction of vaccine-test packages
A technology demonstration using the vaccine-test package, etc., was started in Japan from October 2021,
allowing the relaxation of restrictions due to infection control measures by confirming either vaccination
history or test results. How could the introduction of the vaccine-test package change our lives?
In terms of the spread of infections, complete infection protection is not possible even after vaccination.
It has become clear that with the Pfizer + BioNTech and Moderna vaccines, the ones mainly used in Japan,
very high infection-prevention effects of 90% or more are maintained from about two weeks to three months
after the second dose, but they then decrease after that. Because of that, there is also a view that tests
should be carried out at the same time as confirmation of vaccination rather than just the latter.
The focus of discussion here is mainly to protect people who cannot be vaccinated, people in whom adequate
immunity has not been established even after vaccination, and people in whom the effects of the vaccine have
weakened. It can be assumed that the onset or worsening of disease will be suppressed effectively in people
who have been vaccinated and established adequate immunity, but it is necessary to control infection itself
to protect people who cannot be vaccinated and people in whom adequate immunity cannot be established
despite vaccination4. In addition, if people in whom immunity has been established as a result of
vaccination are infected, known as breakthrough infection, it will be necessary to wait for future
investigation of rates of increased severity of illness and sequelae at the stage when vaccine effects begin
to decrease in particular. Because of this kind of situation, it will be necessary for the time being also
to control the number of infections, rather than just aim to control the frequency of increased
severity.
The following analysis (Figure 6) is a simulation (assuming the delta strain) assuming that a state of
emergency will not be declared even if the number of infections increases and that flows of people have
returned to intermediate level between the pre-COVID-19 and crowd level of last year. It has been pointed
out that if vaccine-test packages are not
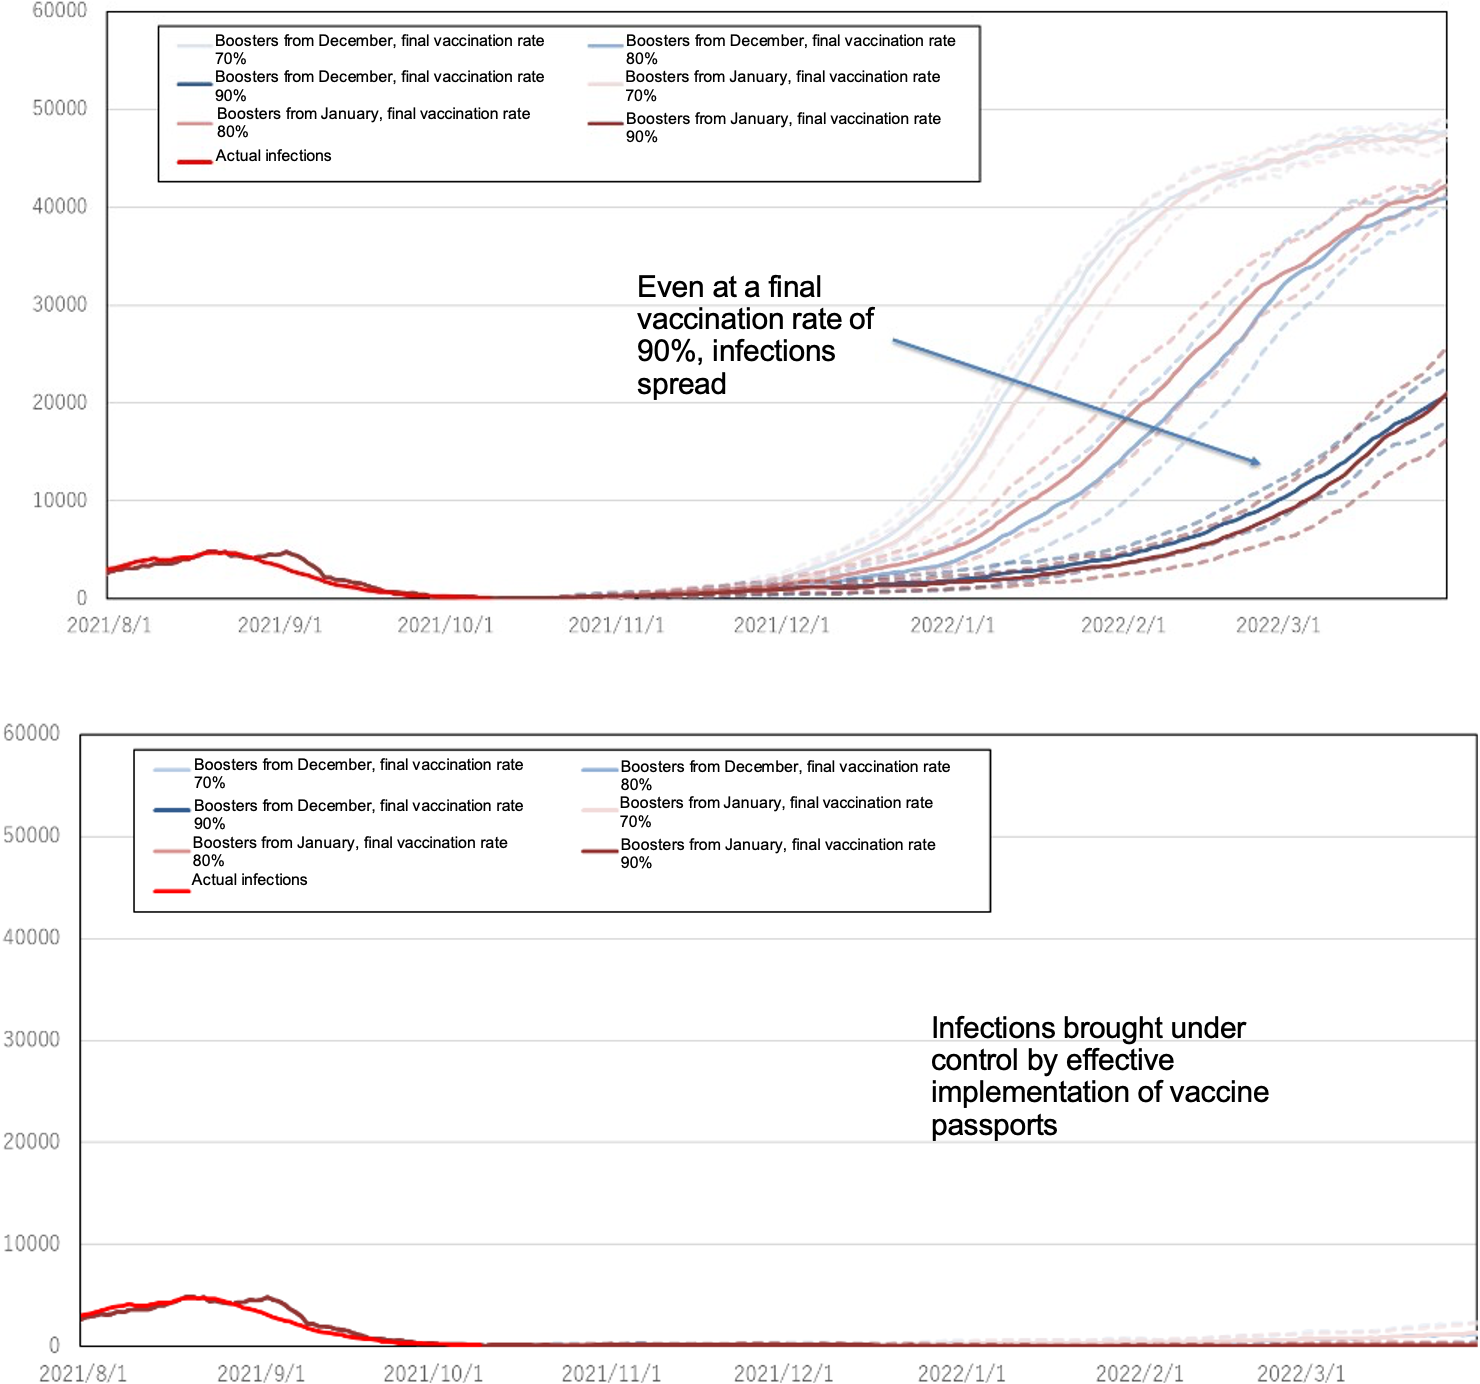
Figure 6: Tokyo: Number of new infections in Tokyo in the case of 0% (top) and 50% (bottom) self-restraint
rate among unvaccinated people (analysis by Professor Kurihara, Keio University)
Related research: RQ4: “Proposal of human behavior model and infection simulation based on SNS and news
report data,”
/action/survey/covid19-ai.jp/ja-jp/presentation/2021_rq3_countermeasures_simulation/articles/article169/
In addition, effectiveness is also shown in the results of simulation if the declaration of a state of emergency was lifted on October 1 with a maximum vaccination rate of 80%. In this simulation, the effects of the vaccine-test package were analyzed assuming a 25% increase in the number of people present in downtown areas at 7pm after lifting of the declaration. In view of the increase in flows of people during the year-end and New Year holidays, there are concerns that infections may peak again in January, but it is estimated that the peak can be kept to about half by the introduction of a vaccine-test package.
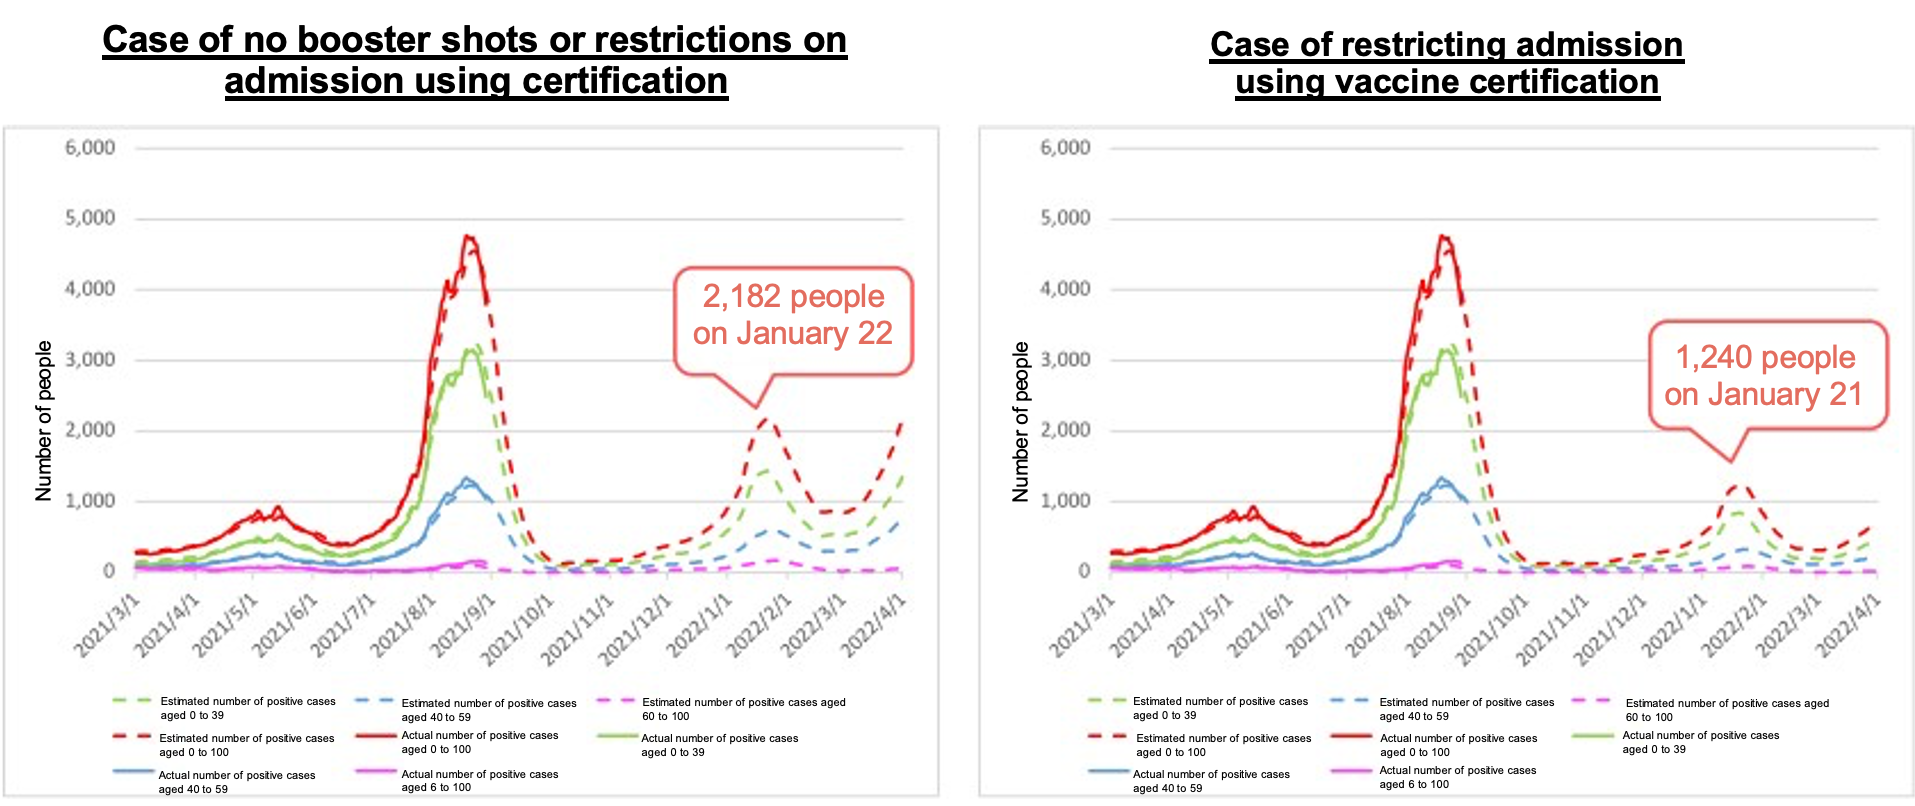
Figure 7: Analysis of the effect of booster vaccinations (booster shots) and a vaccine-test package
(certification) (analysis by Professor Kurahashi, University of Tsukuba)
Related research: RQ4: “Estimates of effects of the date of lifting of declaration, increase in flows of
people, vaccine effect, booster vaccinations, vaccination rates, and vaccination certificate restrictions
(Tokyo),”
/action/survey/covid19-ai.jp/ja-jp/presentation/2021_rq3_countermeasures_simulation/articles/article142/
In this article, we have used simulations to consider how to grasp the “flows of people” that have an impact
on infections and countermeasures against them. We added consideration of the possibility of a vaccine-test
package to control “effective flows of people” and the quality of flows of people for economic recovery and
infection control.
For more precise simulation, it will be necessary to introduce factors such as attenuation of infection
prevention effects dependent on the period after vaccination and the probability of false negative due to
the test method, and this is a future issue.
At the same time, consideration of the period of validity of vaccination certificates will be required
together with the accumulation of scientific and medical data. For example, in Singapore, the period of
validity is one year from 14 days after the second dose, but this will be reviewed along with the
accumulation of data5. Our knowledge of COVID-19
4 In Japan too, research at Chiba University and other institutions has confirmed that there are people who do not produce sufficient antibodies after vaccination with the Pfizer + BioNTech vaccine. In particular, such risks are present in people using immunosuppressants. Kageyama, T., et al., Antibody responses to BNT162b2 mRNA COVID-19 vaccine and their predictors among healthcare workers in a tertiary referral hospital in Japan, Clinical Microbiology and Infection, August, 2021 introduced (assuming 0% of unvaccinated people refrain from going out), a sudden rise in infections could occur even with a final vaccination rate of 90%. On the other hand, simulation results have been obtained showing that in the case of a vaccine-test package introduction rate (from November) of 50% (50% of unvaccinated people refrain from going out), infections can be brought under control.
5 Forum: Timeframe for ‘fully vaccinated’ status to be reviewed as more data becomes available, The
Straits Times, 12 Nov. 2021
(https://www.straitstimes.com/opinion/forum/forum-timeframe-for-fully-vaccinated-status-to-be-reviewed-as-more-data-becomes)
※The simulation introduced in this article is aimed at considering the effects of measures that can be taken under scenarios that can be assumed at the time using various models, and is not aimed at estimating the number of infected people, etc.
1 It is thought that the vaccination of children will likely be approved in the future. “Pfizer and BioNTech apply for marketing approval for their COVID-19 vaccine for children aged five to eleven years in Japan”
https://www.pfizer.co.jp/pfizer/company/press/2021/2021_11_10.html
2 Gold berg, Y. et al., Waning Immunity after the BNT162b2 Vaccine in Israel, New England Journal of Medicine, October 27, 2021 DOI: 10.1056/NEJMoa2114228